NFL QB Rankings, Week 12: Brock Purdy is a mess (and also 2023’s best quarterback)

And Patrick Mahomes falls to the third tier. Numbers, man.

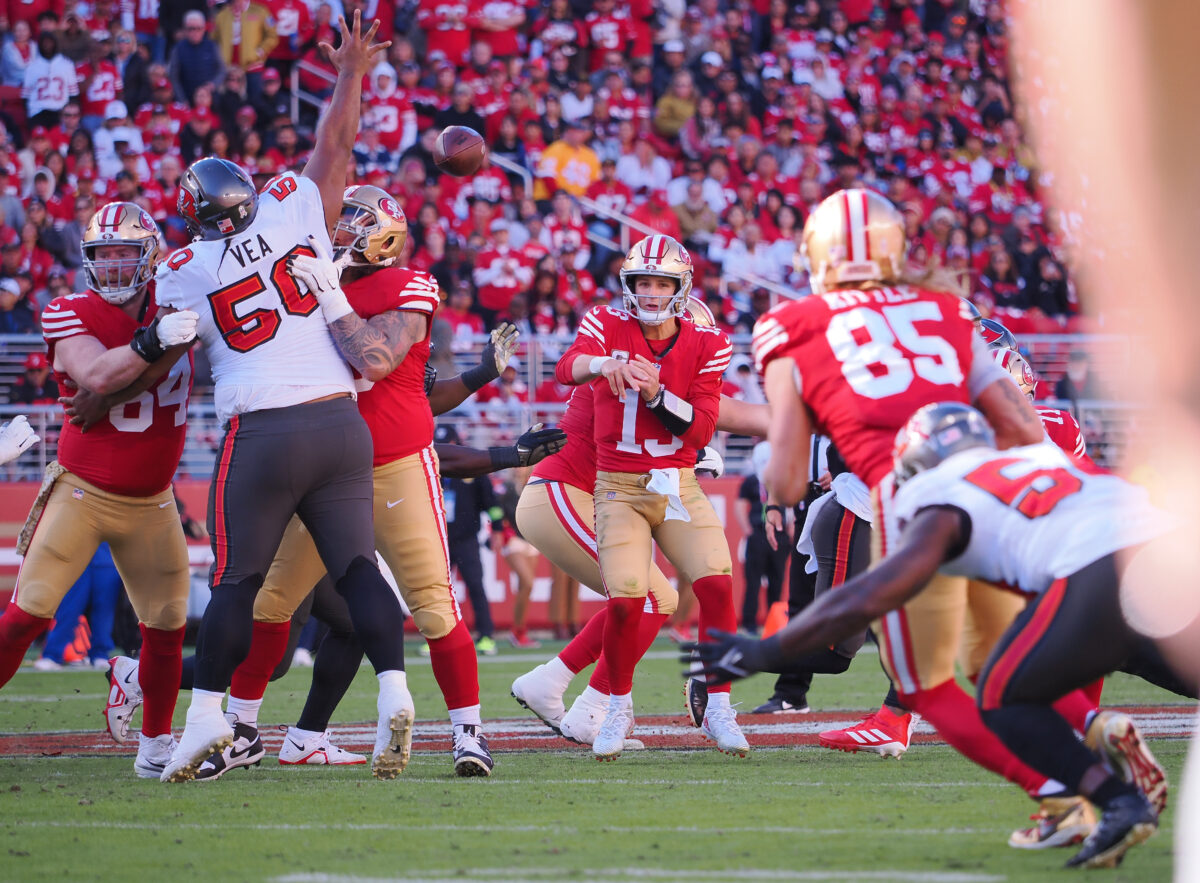
Brock Purdy is 12-3 as an NFL starter in the regular season. His passer rating over that year-plus stint is a league-leading 112.2. He is operating within the confines of Kyle Shanahan’s low risk, high reward offense and thriving.

Does that make him 2023’s best quarterback? The numbers say yes, even if watching his game tape fails to inspire the same confidence.

Purdy has been an upgrade over Jimmy Garoppolo in an offense meant to blunt the liabilities of a shaky downfield passers with motion, movement and a ton of open space to create massive gains after the catch. But when pressed to fit big throws into tight windows downfield, the second-year passer has struggled. His 24 deep throws rank 23rd most in the NFL, a number that looks better than it is given the rash of quarterback injuries that have shaken up starting lineups this fall.

All five of his interceptions this season came in a three-game losing streak that stands as the only blemishes on his team’s 2023 record. Four came on throws at least 13 yards beyond the lin of scrimmage, showcasing his struggles when asked to force the ball downfield in disadvantageous situations. Purdy is very good, but he’s not in the circle of trust just yet.

That doesn’t keep him from holding down the top spot in this week’s advanced stats QB rankings — by a wide margin, in fact.

Let’s talk about those stats. Expected points added (EPA) is a concept that’s been around since 1970. It’s effectively a comparison between what an average quarterback could be expected to do on a certain down and what he actually did — and how it increased his team’s chances of scoring. The model we use comes from The Athletic’s Ben Baldwin and his RBSDM.com website, which is both wildly useful AND includes adjusted EPA, which accounts for defensive strength. It considers the impact of penalties and does not negatively impact passers for fumbles after a completion.

The other piece of the puzzle is completion percentage over expected (CPOE), which is pretty much what it sounds like. It’s a comparison of all the completions a quarterback would be expected to make versus the ones he actually did. Like EPA, it can veer into the negatives and higher is better. So if you chart all 32 primary quarterbacks — the ones who played at least 176 snaps in 11 weeks — you get a chart that looks like this:

via RBSDM.com

Top right hand corner is good. Bottom left corner is bad. Try splitting those passers visually into tiers and you get an imperfect eight-layer system that looks like this:

via RBSDM.com and the author

These rankings are sorted by a composite of adjusted EPA and CPOE to better understand who has brought the most — and the least — value to their teams across the small sample size. It’s not a full exploration of a player’s value, but it’s a viable starting point. Let’s take a closer look.

NFL QB Rankings, Week 9: The Raiders paid $72 million for one of the league’s worst passers

Joe Burrow and Jalen Hurts are rising up the ranks. Garoppolo? Hooo buddy, no.

Jimmy Garoppolo is a problem.

He always kinda has been, but San Francisco 49ers head coach Kyle Shanahan was able to mitigate his inability to throw downfield and penchant for tossing wild, interceptable passes on short routes by surrounding him with playmakers. With guys like Deebo Samuel, George Kittle and Brandon Aiyuk on the roster he was able to help push the Niners to three conference title games in four years.

The Las Vegas Raiders tried to replicate that success, knowing it had a specific ceiling but understanding fully the struggle of landing a franchise quarterback on the open market. It had a ready-made crutch for Garoppolo’s worst throws in Davante Adams, who is about as good a bailout artist as you’ll find in the NFL.

But Adams, through no fault of his own, has just 14 catches in his last four weeks, forced to watch a near-sighted passer throw well outside his field of vision. Las Vegas is 2-2 in these games, but that’s more a function of having played the two-win Green Bay Packers and New England Patriots in back-to-back weeks. Before getting rolled by the Detroit Lions — a game where Adams had seven targets and one catch — the Raiders also snuck in an 18-point loss to Tyson Bagent and the Chicago Bears.

Garoppolo didn’t play against Chicago (and he won’t against the New York Giants in Week 9, because he’s been benched), but he averaged just 165 passing yards per game in the other three contests. He threw more interceptions (three) than touchdowns (two) and lost 70 yards via sack. His expected points added (EPA) in that span is -0.201 per play — worse than any other starter but Joshua Dobbs and Zach Wilson. Advanced stats paint him as one of the worst quarterbacks in the NFL this fall. And that’s what the Raiders, now coach-less after (justifiably) firing Josh McDaniels, owe $11 million — and a $28 million salary cap — to in 2024.

Let’s talk about those stats. Expected points added (EPA) is a concept that’s been around since 1970. It’s effectively a comparison between what an average quarterback could be expected to do on a certain down and what he actually did — and how it increased his team’s chances of scoring. The model we use comes from The Athletic’s Ben Baldwin and his RBSDM.com website, which is both wildly useful AND includes adjusted EPA, which accounts for defensive strength. It considers the impact of penalties and does not negatively impact passers for fumbles after a completion.

The other piece of the puzzle is completion percentage over expected (CPOE), which is pretty much what it sounds like. It’s a comparison of all the completions a quarterback would be expected to make versus the ones he actually did. Like EPA, it can veer into the negatives and higher is better. So if you chart all 32 primary quarterbacks — the ones who played at least 128 snaps in eight weeks — you get a chart that looks like this:

via RBSDM.com

Top right hand corner is good. Bottom left corner is bad. Try splitting those passers into tiers and you get an imperfect seven-layer system that looks like this:

via RBSDM.com and the author

These rankings are sorted by a composite of adjusted EPA and CPOE to better understand who has brought the most — and the least — value to their teams across the small sample size. It’s not a full exploration of a player’s value, but it’s a viable starting point. Let’s take a closer look.

NFL Quarterback Rankings Week 9: Tua Tagovailoa, the league’s best QB

Tagovailoa’s comeback effort vs. Detroit pushed him to the top. The rest of the top 10 is dotted with names you wouldn’t expect.

There are several metrics that suggest Tua Tagovailoa, working with a new head coach and a massively upgraded offense, has made *the leap* in 2022. He leads the league in passer rating (112.7), QB rating (78.7) and yards per pass attempt (9.0). His 313 yards per game he’s been able to finish is second only to Josh Allen. His touchdown and completion rates are both top three.

And when it comes to advanced stats, he stands alone at the top of the quarterback mountain.

Tagovailoa ascended to the No. 1 spot when it comes to overall efficiency this fall, taking advantage of Patrick Mahomes’ week off and Allen’s late struggles against the Green Bay Packers. The Miami Dolphins’ third-year quarterback led his team back from a 10-point halftime deficit (against the Detroit Lions, but still) while throwing for 382 yards and three touchdowns without a turnover in Week 8.

That left everyone looking up at a player whose status as a franchise quarterback was uncertain back in August. Tagovailoa is 2022’s top passer so far. Now let’s see who comes next.

We know the data is limited — but it does give us a pretty good idea of who has risen to the occasion this fall. Let’s see which quarterbacks are great and who truly stinks through seven weeks. These numbers are from the NFL’s Next Gen Stats model but compiled by the extremely useful RBSDM.com, run by The Athletic’s Ben Baldwin and Sebastian Carl.

Using expected points added (EPA, the value a quarterback adds on any given play compared to the average NFL result) along with completion percentage over expected (CPOE, the percent of his passes that are caught that aren’t expected to be in typical NFL situations) gives us a scatter plot of 36 quarterbacks (minimum 112 plays) that looks like this:

via RBSDM.com

The size of each dot represents the amount of plays they’ve been a part of. A place in the top right means you’re above average in both EPA and CPOE. A place in the bottom left suggests things have gone horribly wrong (i.e. Baker Mayfield).

There are a lot of players taking up the creamy middle ground and some strange outliers, making it tough to separate this year’s average quarterbacks into tiers. Here’s my crack at it, but full details follow in the text below.

via RBSDM.com

[mm-video type=video id=01ggwgp2hew5saj7xmse playlist_id=none player_id=none image=https://images2.minutemediacdn.com/image/upload/video/thumbnail/mmplus/01ggwgp2hew5saj7xmse/01ggwgp2hew5saj7xmse-dff782c246ca082239ad4930c2227e71.jpg]

NFL QB Rankings Week 8: Joe Burrow rises and Daniel Jones (!) joins the top 10

Jones’ penchant for efficient play and fourth quarter comebacks pushed him into the top 10. Just a few spots behind Geno Smith, in fact.

The New York Giants are 6-1 and have the second-best record in the NFC. All of this has been made possible by their top 10 quarterback, Daniel Jones.

That is an absolutely wild pair of sentences to write and, per the NFL’s advanced stats, a completely true one. Jones has led four fourth quarter comebacks and five game winning drives in seven appearances this season. In Week 7, he erased a 17-13 Jacksonville Jaguars lead with less than six minutes to play with a one-yard touchdown plunge. Minutes later, he led a 61-yard field goal drive that added vital insurance points.

Granted, that hasn’t been a heavy lift through the air — that final drive didn’t feature a single pass. Still, Jones has been his most efficient self despite an offense where his top three healthy, non-tailback targets are Richie James, Darius Slayton and Daniel Bellinger.

So yeah … he has a solid case for that top 10 status. Now let’s figure out who joined him after seven weeks of the 2022 NFL season.

We know the data is limited — but it does give us a pretty good idea of who has risen to the occasion this fall. Let’s see which quarterbacks are great and who truly stinks through seven weeks. These numbers are from the NFL’s Next Gen Stats model but compiled by the extremely useful RBSDM.com, run by The Athletic’s Ben Baldwin and Sebastian Carl.

Using expected points added (EPA, the value a quarterback adds on any given play compared to the average NFL result) along with completion percentage over expected (CPOE, the percent of his passes that are caught that aren’t expected to be in typical NFL situations) gives us a scatter plot of 38 quarterbacks (minimum 64 plays) that looks like this:

via RBSDM.com

The size of each dot represents the amount of plays they’ve been a part of. A place in the top right means you’re above average in both EPA and CPOE. A place in the bottom left suggests things have gone horribly wrong (i.e. Baker Mayfield).

There are a lot of players taking up the creamy middle ground and some strange outliers, making it tough to separate this year’s average quarterbacks into tiers. Here’s my crack at it, but full details follow in the text below.

Via RBSDM.com

NFL QB Tiers Week 6: Josh Allen reclaims his throne, Russell Wilson and Matthew Stafford stare up in envy

Allen is No. 1 in the NFL. Geno Smith? No. 3. Russell Wilson and Matthew Stafford, on the other hand, are light years behind.

Josh Allen, as we all expected, is the most valuable quarterback in the NFL through five games. Geno Smith, as only the most demented — or brilliant? — football minds saw coming, is right on his heels.

Smith’s age-32 breakthrough continued last week in a 268-yard, three touchdown performance on only 25 pass attempts against the New Orleans Saints. This wasn’t a function of quick dump-offs and big runs after the catch — though Jimmy Garoppolo has parlayed that into a top 10 ranking (!). Smith threw four passes at least 25 yards downfield. All four were caught and three were touchdowns.

That keeps him on the upper tier for another week, even if his place at the top has been justifiably usurped by Allen and Patrick Mahomes. How’d everyone else shake out? Let’s turn to advanced stats to figure out who brings the most value behind center.

We know the data is limited — but it does give us a pretty good idea of who has risen to the occasion this fall. Let’s see which quarterbacks are great and who truly stinks through four games in the 2022 NFL season. These numbers are from the NFL’s Next Gen Stats model but compiled by the extremely useful RBSDM.com, run by The Athletic’s Ben Baldwin and Sebastian Carl.

Using expected points added (EPA, the value a quarterback adds on any given play compared to the average NFL result) along with completion percentage over expected (CPOE, the percent of his passes that are caught that aren’t expected to be in typical NFL situations) gives us a scatter plot of 32 quarterbacks (minimum 80 plays) that looks like this:

via RBSDM.com

The size of each dot represents the amount of plays they’ve been a part of. A place in the top right means you’re above average in both EPA and CPOE. A place in the bottom left suggests things have gone horribly wrong (i.e. Baker Mayfield).

There are a lot of players taking up the creamy middle ground, making it tough to separate this year’s average quarterbacks into tiers. Here’s my crack at it, but full details follow in the text below.

via RBSDM.com and the author

NFL QB Tiers Week 4: The ruling class is 5 deep (and includes Trevor Lawrence)

Patrick Mahomes and Josh Allen? We knew they were great. Tua Tagovailoa and Trevor Lawrence? That’s a bit more surprising.

After two weeks, a limited sample size of painted Jacoby Brissett and Geno Smith as top 10 NFL quarterbacks. After three weeks … well, they’re *both* still up there.

The Cleveland Browns’ fill-in quarterback continued to build his value after a proficient Thursday Night Football performance. The athleticism that made him a value-play 2016 third round pick for a New England Patriots team with both Tom Brady and Jimmy Garoppolo on the roster was on display as Brissett avoided conflict in the pocket and threw absolute darts downfield.

Brissett finished his day with a 21-for-31, two touchdown, zero interception line in a 29-17 win over a division rival. He led four different scoring drives of at least 60 yards. And his night probably should have been even better!

Brissett’s Browns are one Nick Chubb red zone kneel-down from their first 3-0 start since 1993. Granted, those games have come against the Panthers, Jets and Steelers, but the journeyman backup has given Cleveland exactly what it needs to survive Deshaun Watson’s 11-game suspension following more than 20 accusations of sexual misconduct and what the NFL described as “predatory behavior.”

Smith, on the other hand, threw for 325 yards but lost to the Atlanta Falcons when his fourth-and-18 heave was intercepted with 90 seconds to play. That marred an otherwise solid performance — the third-highest yardage total of his career — that furthers the theory he’s a useful, if flawed, starting NFL quarterback.

But neither of these guys are elite. You know who is, per advanced stats? Tua Tagovailoa and Trevor Lawrence. Let’s see which quarterbacks are great and who truly stinks through three games in the 2022 NFL season. These numbers are from the NFL’s Next Gen Stats model but compiled by the extremely useful RBSDM.com, run by The Athletic’s Ben Baldwin and Sebastian Carl.

Using expected points added (EPA, the value a quarterback adds on any given play compared to the average NFL result) along with completion percentage over expected (CPOE, the percent of his passes that are caught that aren’t expected to be in typical NFL situations) gives us a scatter plot of 33 quarterbacks (minimum 48 plays) that looks like this:

via RBSDM.com

The size of each dot represents the amount of plays they’ve been a part of. A place in the top right means you’re above average in both EPA and CPOE. A place in the bottom left suggests things have gone horribly wrong.

Since there’s a big congestion in the middle, it’s a little tougher to legibly divide this week’s group into tiers. Fortunately, I’ll have a full explanation of who fits where below.

via RBSDM.com and the author