Final stat leaders for the Chargers in 2024

Ladd McConkey led all receivers in every category except for touchdowns.

All attention has shifted to the offseason, but while it’s still fresh, we can still reflect on this past season for the Chargers.

Here are the final stat leaders from the 2024 regular season.

Offense

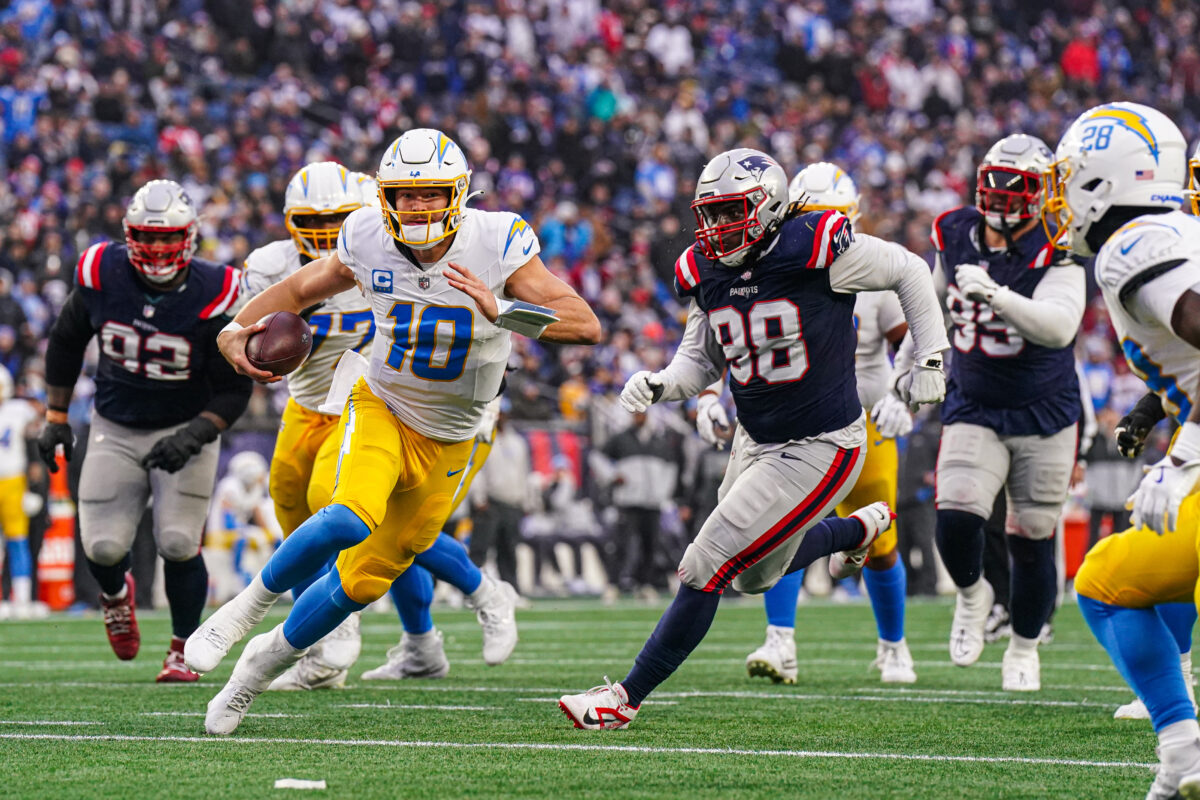
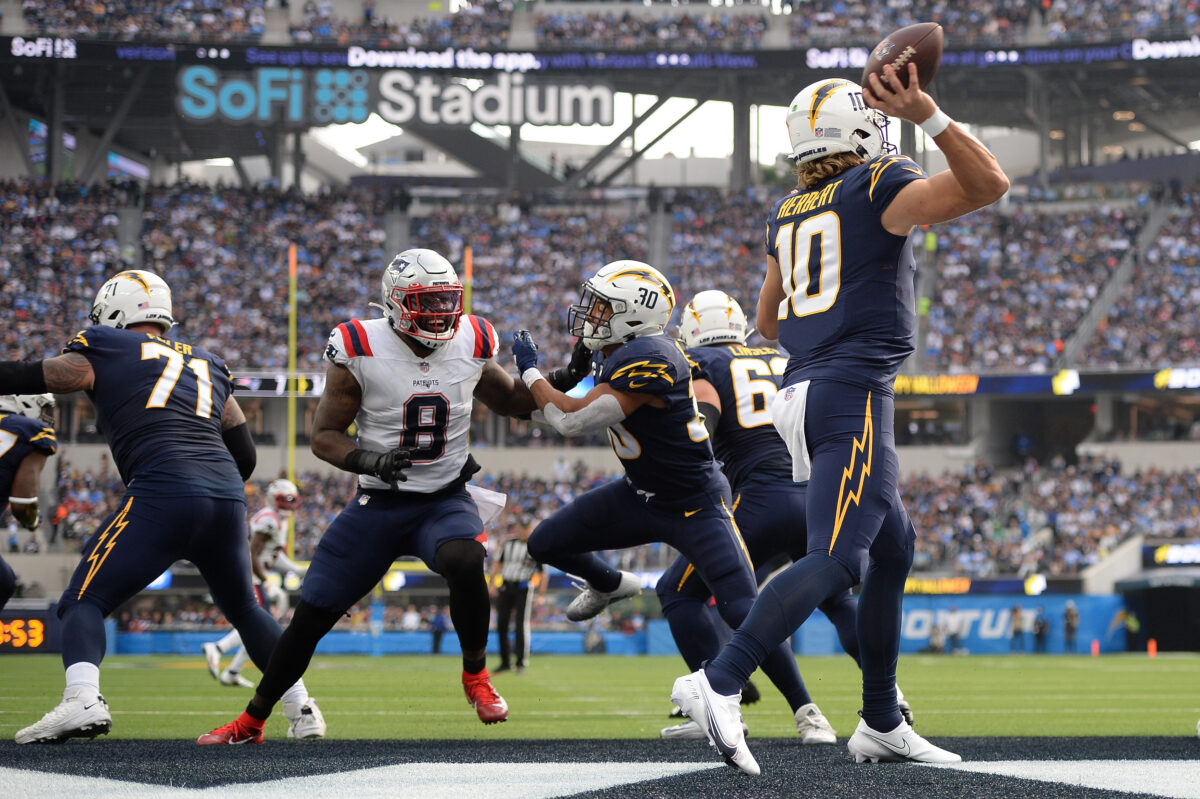
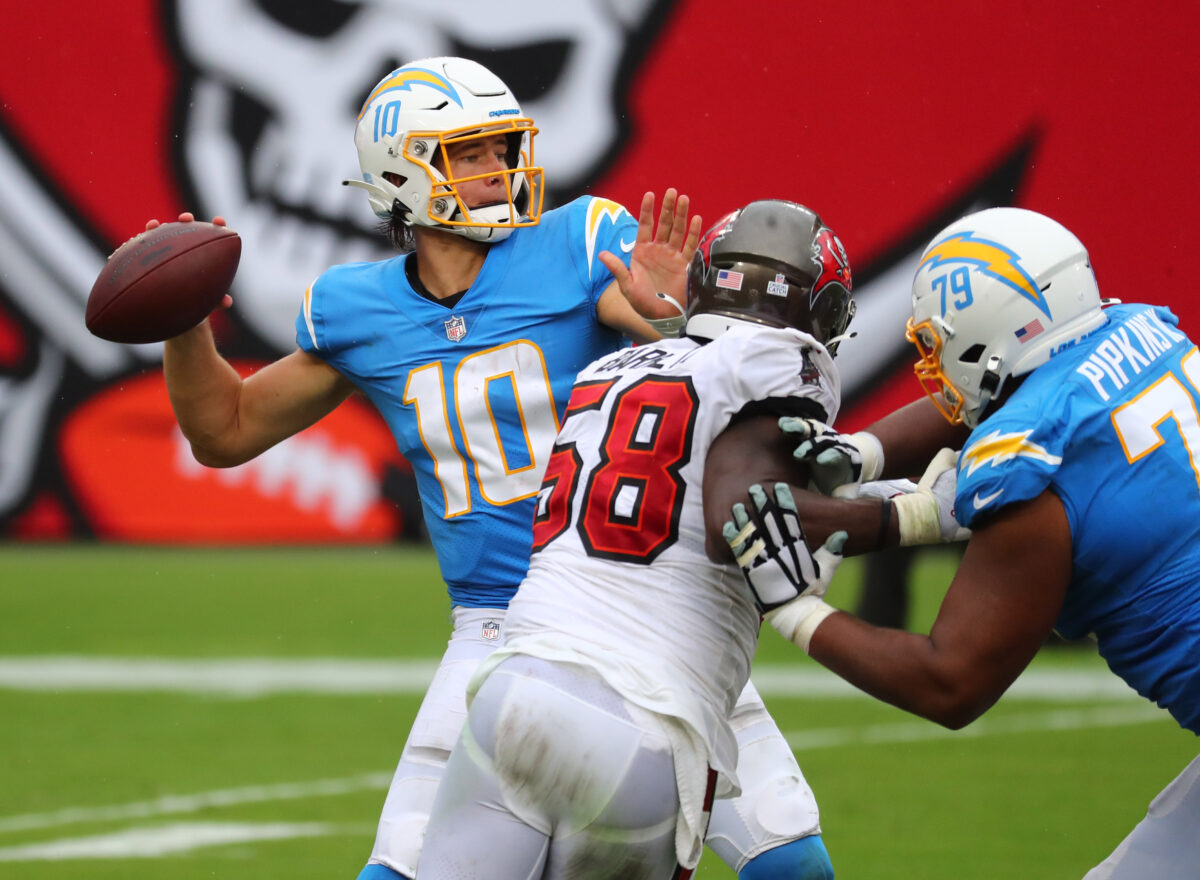
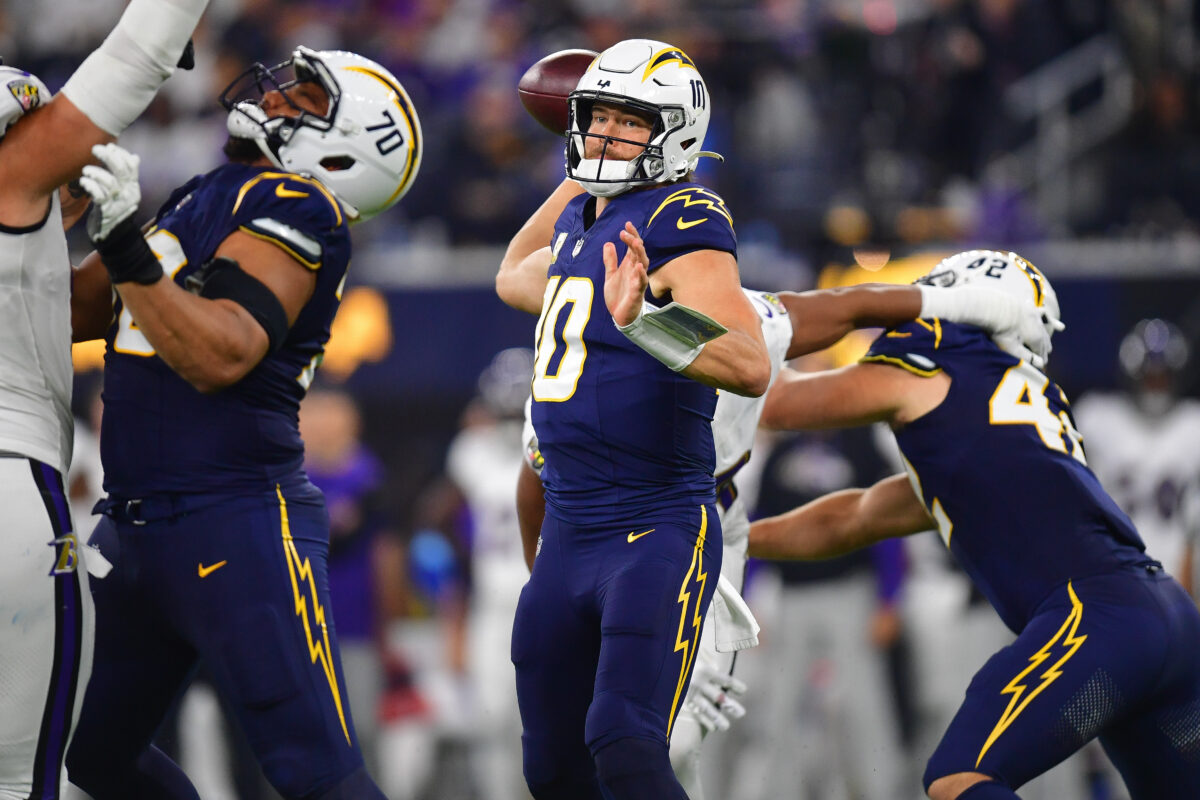
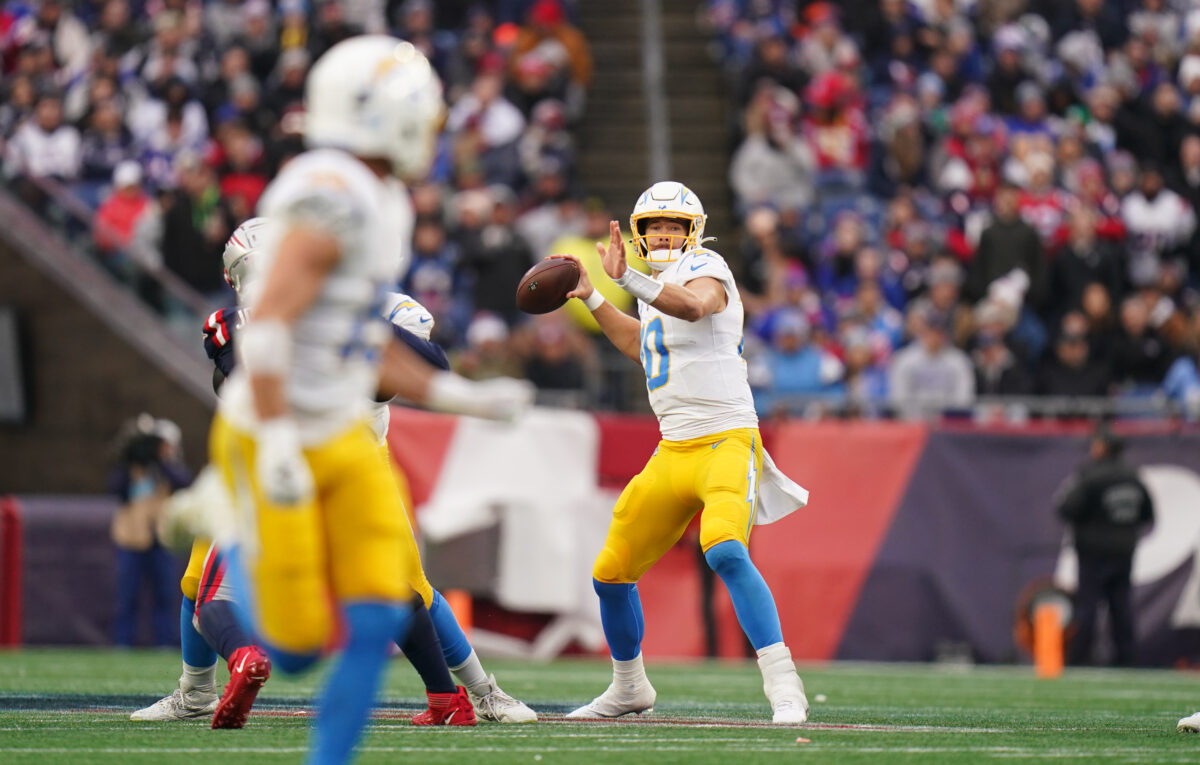
Touchdown Passes – QB Justin Herbert (23)

Passing Yards – QB Justin Herbert (3,870)

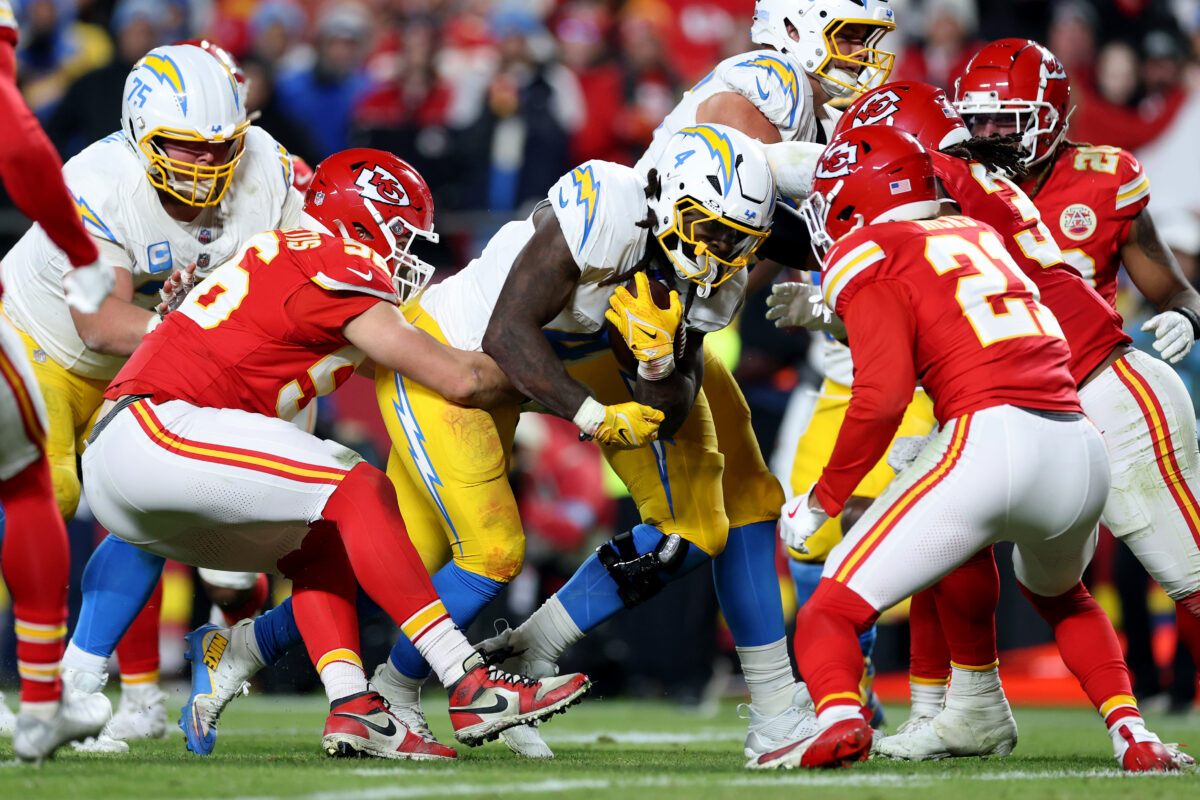
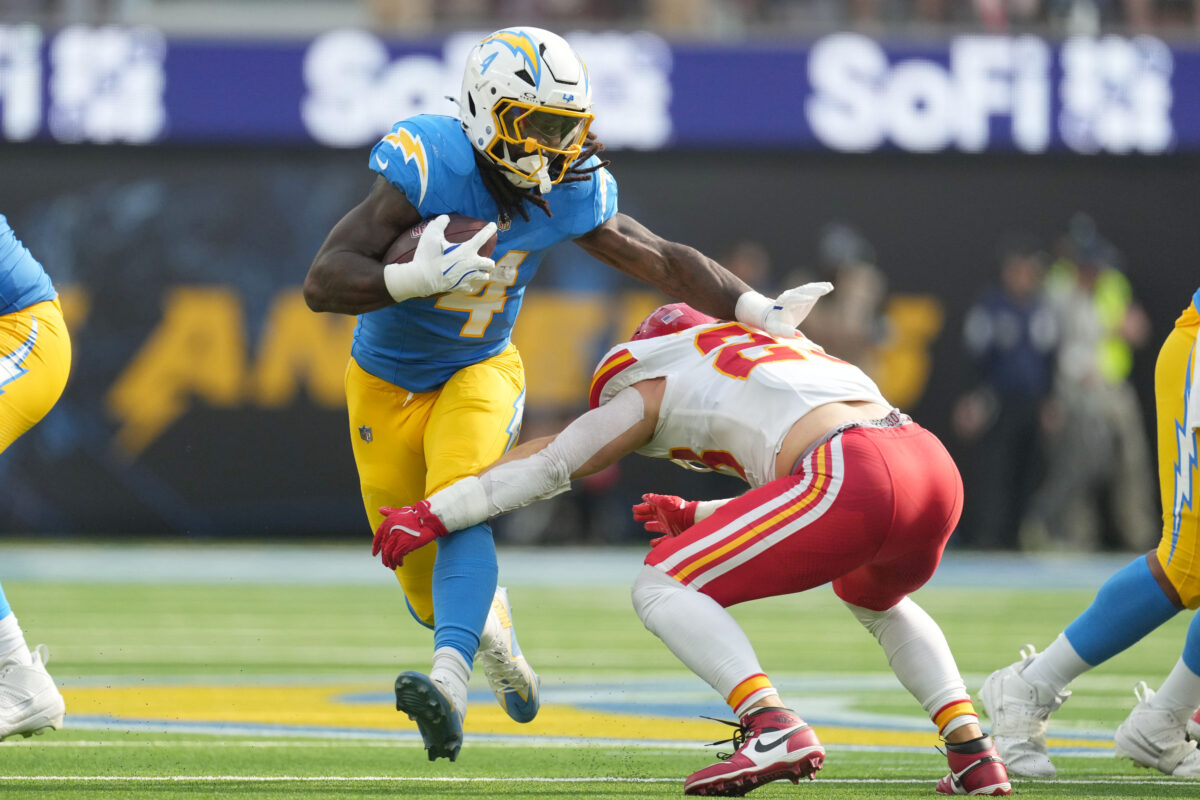
Rushing Yards – RB J.K. Dobbins (905)

Rushing Touchdowns – RB J.K. Dobbins (9)

Receptions – WR Ladd McConkey (82)

Receiving Touchdowns – WR Quentin Johnston (8)

Receiving Yards – WR Ladd McConkey (1,149)

Yards Per Catch — WR Simi Fehoko (17.0)

Defense

Sacks – EDGE Tuli Tuipulotu (8.5)

Tackles – LB Daiyan Henley (147)

Interceptions – CB Tarheeb Still (4)

Passes Defensed – CB Tarheeb Still (10)

Forced Fumbles – EDGE Khalil Mack, Joey Bosa (2)

Quarterback Pressures — EDGE Khalil Mack (52)

Punt Return Yards – WR Derius Davis (235)

Kick Return Yards – WR Derius Davis (524)

Statistical Breakdown: How the Chargers and Texans stack up before wild-card playoff game

The Texans have struggled at keeping their quarterback clean, but they’ve also generated a lot of pressure on opposing quarterbacks

The Chargers and Texans are set to square off this Saturday, with both teams looking to advance to the divisional round.

Here’s how Los Angeles and Houston stack up statistically on both sides of the ball ahead of the wild-card matchup:

Offense

Category Chargers Texans
Points per game 23.6 ppg (11th) 21.9 ppg (19th)
Passing offense 213.5 ypg (19th) 207.4 ypg (21st)
Rushing offense 110.7 ypg (17th) 112.3 ypg (15th)
Total offense 324.2 ypg (20th) 319.7 ypg (22nd)
3rd down conversions 40.27% (11th) 37.66% (20th)
Red zone scoring 56.00% (18th) 49.12% (26th)
Sacks allowed 44 (19th) 54 (29th)
Turnovers 9 (2nd) 19 (12th)

Defense

Category Chargers Texans
Points allowed 17.7 ppg (1st) 21.9 ppg (14th)
Passing defense 206.9 ypg (7th) 201.0 ypg (6th)
Rushing defense 117.5 ypg (14th) 114.0 ypg (11th)
Total defense 324.4 ypg (11th) 315.0 ypg (6th)
3rd down conversions 35.71% (5th) 35.91% (7th)
Red zone defense 45.00% (1st) 63.64% (27th)
Sacks 46 (6th) 49 (4th)
Takeaways 21 (13th) 29 (5th)


Where the Chargers rank statistically ahead of Week 18

The Chargers have found a spark offensively while continuing to boast one of the league’s top defenses.

The Chargers head into the regular season finale on Sunday with a 10-6 record and a spot in the playoffs locked up.

Los Angeles has found its spark on the offensive side of the ball in recent weeks while continuing to boast one of the league’s best defenses.

With Week 18 coming up, how do the Bolts compare to the rest of the NFL? Here is where Los Angeles ranks:

Offense

Category Stat Rank
Points per game 23.0 ppg 12th
Passing offense 205.8 ypg 21st
Rushing offense 109.1 ypg 18th
Total offense 314.9 ypg 23rd
3rd down conversions 39.61% 14th
Red zone scoring 56.82% 16th
Sacks allowed 43 19th
Turnovers 9 2nd

Defense

Category Stat Rank
Points allowed 17.6 ppg 1st
Passing defense 205.8 ypg 8th
Rushing defense 122.4 ypg 16th
Total defense 328.1 ypg 12th
3rd down conversions 36.28% 9th
Red zone defense 44.74% 1st
Sacks 46 6th
Takeaways 20 13th


Statistical Breakdown: How the Chargers and Patriots stack up before Week 17 game

Here’s how the Chargers and Patriots stack up statistically on offense and defense ahead of Saturday’s matchup.

The Chargers and Patriots are set to square off this Saturday.

Here’s how Los Angeles and New England stack up statistically on both sides of the ball ahead of the Week 17 matchup:

Offense

Category Chargers Patriots
Points per game 21.9 ppg (18th) 17.3 ppg (30th)
Passing offense 200.8 ypg (28th) 178.5 ypg (32nd)
Rushing offense 106.5 ypg (23rd) 119.7 ypg (14th)
Total offense 307.3 ypg (24th) 298.3 ypg (29th)
3rd down conversions 37.89% (18th) 35.75% (26th)
Red zone scoring 57.50% (14th) 47.73% (31st)
Sacks allowed 43 (21st) 47 (26th)
Turnovers 9 (2nd) 21 (20th)

Defense

Category Chargers Patriots
Points allowed 18.3 ppg (1st) 24.1 ppg (24th)
Passing defense 213.9 ypg (15th) 212.4 ypg (12th)
Rushing defense 124.1 ypg (17th) 130.4 ypg (24th)
Total defense 337.9 ypg (15th) 342.8 ypg (21st)
3rd down conversions 37.07% (10th) 42.08% (25th)
Red zone defense 44.74% (1st) 62.75% (24th)
Sacks 42 (7th) 28 (31st)
Takeaways 19 (14th) 12 (29th)


Statistical Breakdown: How the Chargers and Buccaneers stack up before Week 15 game

Here’s how the Chargers and Buccaneers stack up statistically on offense and defense ahead of Sunday’s matchup.

The Chargers and Buccaneers are set to square off this Sunday.

Here’s how Los Angeles and Tampa Bay stack up statistically on both sides of the ball ahead of the Week 15 matchup:

Offense

Category Chargers Buccaneers
Points per game 21.3 ppg (20th) 27.9 ppg (5th)
Passing offense 198.1 ypg (25th) 241.0 ypg (6th)
Rushing offense 111.5 ypg (19th) 138.3 ypg (7th)
Total offense 309.5 ypg (24th) 379.3 ypg (3rd)
3rd down conversions 38.37% (15th) 47.17% (2nd)
Red zone scoring 54.55% (19th) 68.63% (4th)
Sacks allowed 38 (23rd) 32 (16th)
Turnovers 6 (1st) 18 (20th)

Defense

Category Chargers Buccaneers
Points allowed 15.9 ppg (1st) 23.8 ppg (22nd)
Passing defense 206.1 ypg (8th) 253.4 ypg (30th)
Rushing defense 117.6 ypg (14th) 115.2 ypg (11th)
Total defense 323.7 ypg (11th) 368.5 ypg (28th)
3rd down conversions 35.03% (7th) 41.92% (23rd)
Red zone defense 41.94% (1st) 51.02% (10th)
Sacks 39 (5th) 35 (11th)
Takeaways 17 (10th) 16 (14th)

Justin Herbert on pace to break impressive record

Justin Herbert is on pace to break this record that’s currently held by Peyton Manning.

Justin Herbert is on pace to accomplish an outstanding feat.

Herbert needs 631 more passing yards to surpass the record for the most passing yards in a player’s first five seasons.

Currently held by Peyton Manning (20,617), Herbert must average 158 yards per game over the next four weeks to surpass the record.

Herbert surpassed Jameis Winston for the second-most passing yards in a player’s first five NFL seasons in the first half of the Chargers’ Week 13 win over the Falcons.

Herbert has had one of the least productive passing seasons, averaging just 212.6 yards per game. But he’s still been as sharp as ever and has done a good job taking care of the football, having only thrown one interception.

Where the Chargers rank statistically after Week 14

The Chargers held the Chiefs to less than 300 yards of total offense, so how did that impact them in the rankings?

The Chargers fell to 8-5 after losing to the Chiefs on Sunday night.

Los Angeles’ defense held its own, limiting Kansas City to less than 300 yards of total offense and containing Patrick Mahomes for most of the game. Offensively, the Bolts couldn’t get anything going in the first half but had a surge in the second half.

With Week 15 coming up, how do the Bolts compare to the rest of the NFL? Here is where Los Angeles ranks:

Offense

Category Stat Rank
Points per game 21.3 ppg 20th
Passing offense 198.1 ypg 25th
Rushing offense 111.5 ypg 19th
Total offense 309.5 ypg 24th
3rd down conversions 38.37% 15th
Red zone scoring 54.55% 19th
Sacks allowed 38 23rd
Turnovers 6 1st

Defense

Category Stat Rank
Points allowed 15.9 ppg 1st
Passing defense 206.1 ypg 8th
Rushing defense 117.6 ypg 14th
Total defense 323.7 ypg 11th
3rd down conversions 35.03% 7th
Red zone defense 41.94% 1st
Sacks 39 5th
Takeaways 17 10th


Statistical Breakdown: How the Chargers and Chiefs stack up before Week 14 game

Here’s how the Chargers and Chiefs stack up statistically on offense and defense ahead of Sunday’s matchup.

The Chargers and Chiefs are set to square off this upcoming Sunday night.

Here’s how Los Angeles and Kansas City stack up statistically on both sides of the ball ahead of the Week 14 matchup:

Offense

Category Chargers Chiefs
Points per game 21.7 ppg (18th) 24.1 ppg (11th)
Passing offense 198.4 ypg (24th) 229.8 ypg (12th)
Rushing offense 112.9 ypg (18th) 111.8 ypg (19th)
Total offense 311.3 ypg (24th) 341.6 ypg (15th)
3rd down conversions 37.74% (18th) 51.83% (1st)
Red zone scoring 53.33% (21st) 52.08% (24th)
Sacks allowed 35 (23rd) 32 (20th)
Turnovers 6 (1st) 14 (14th)

Defense

Category Chargers Chiefs
Points allowed 15.7 ppg (1st) 19.6 ppg (8th)
Passing defense 206.4 ypg (10th) 224.1 ypg (23rd)
Rushing defense 119.4 ypg (14th) 87.3 ypg (3rd)
Total defense 325.8 ypg (14th) 311.9 ypg (8th)
3rd down conversions 33.33% (2nd) 39.46% (18th)
Red zone defense 42.86% (2nd) 51.28% (10th)
Sacks 36 (6th) 24 (27th)
Takeaways 17 (10th) 10 (27th)

Where the Chargers rank statistically after Week 13

The Chargers only mustered 187 yards of total offense, so how did that impact them in the rankings?

The Chargers improved to 8-4 after beating the Falcons in Week 13.

Los Angeles’ defense, which compiled four interceptions on the day, was why they won the game. The offense only managed 187 yards of total offense and allowed five sacks to a Falcons defense with just ten entering Sunday.

With Week 14 coming up, how do the Bolts compare to the rest of the NFL? Here is where Los Angeles ranks:

Offense

Category Stat Rank
Points per game 21.7 ppg 18th
Passing offense 198.4 ypg 24th
Rushing offense 112.9 ypg 18th
Total offense 311.3 ypg 24th
3rd down conversions 37.74% 18th
Red zone scoring 53.33% 21st
Sacks allowed 30 21st
Turnovers 5 1st

Defense

Category Stat Rank
Points allowed 15.7 ppg 1st
Passing defense 206.4 ypg 10th
Rushing defense 119.4 ypg 14th
Total defense 325.8 ypg 14th
3rd down conversions 33.33% 2nd
Red zone defense 42.86% 2nd
Sacks 35 T-6th
Takeaways 13 14th


Where the Chargers rank statistically after Week 12

The Chargers allowed a season-high 30 points, so how did that impact them in the rankings?

The Chargers fell to 7-4 after losing to the Ravens in Week 12.

Los Angeles’ defense was dominated by Baltimore’s ground game, which accrued 212 yards, the most given up in Jim Harbaugh’s coaching career. After not allowing more than 20 points in the first nine weeks of the season, the Bolts gave up 27 and 30 points in the past two weeks.

With Week 13 coming up, how do the Bolts compare to the rest of the NFL? Here is where Los Angeles ranks:

Offense

Category Stat Rank
Points per game 22.1 ppg 18th
Passing offense 204.5 ypg 20th
Rushing offense 118.1 ypg 13th
Total offense 322.6 ypg 21st
3rd down conversions 38.51% 16th
Red zone scoring 57.14% 13th
Sacks allowed 30 21st
Turnovers 5 1st

Defense

Category Stat Rank
Points allowed 15.9 ppg 1st
Passing defense 203.9 ypg 13th
Rushing defense 119.7 ypg 15th
Total defense 323.6 ypg 13th
3rd down conversions 34.46% 8th
Red zone defense 45.83% 4th
Sacks 35 T-6th
Takeaways 13 14th