Back in 2002 John Dewan, who was behind projects such as Project Scoresheet and Stats, Inc., created Baseball Info Solutions with the goal to be an industry leader of data collection and analysis in baseball. 13 years later, and after becoming that industry leader, BIS rebranded as Sports Info Solutions, and began analyzing football at both the NFL and FBS levels.
Today, SIS is one of the leaders in data collection and analysis in both baseball and football. The SIS Data Hub has a wealth of information for both the NFL and college games, data that can be relied upon for both media and insiders like.
SIS has for the past few years offered their Analytics Challenge, a chance for aspiring data analysts to unpack NFL play-by-play data in an attempt to answer a few different questions. This year, SIS is offering two different tracks, a general football analytics question, as well as a sports betting question.
You might be wondering where I am going with this.
Well, a few weeks ago I came across the general football analytics question, which asked participants to identify the most popular route concepts in the NFL in 2020, as well as ascertain which concepts perform the best versus the different coverage types. As someone who, from a film study perspective, wrote about this recently I thought it would be interesting to try and answer these questions.
However, my coding and data analysis skills are very much on par with the old saw about a room full of monkeys banging away at typewriters. Eventually I might get to the right answer, like those monkeys eventually landing on “Romeo and Juliet” as the joke goes, but it is going to take a long time. So I reached out to someone with much deeper coding chops than myself, and was lucky enough to join a great group of people:
Before going any further, I strongly recommend that you follow all three: Dr. Bud Davis, Keegan Abdoo and Joey Ferraiola. They’re brilliant, and approximately 98% of what follows is due to their work.
All entrants were given a pack of play-by-play data with which to answer the questions posed. But my reason for entering this project was somewhat specific. I wanted to test some of the theories posited in the above article. Was my idea of route concepts that can attack both middle-of-the-field-open, as well as middle-of-the-field-closed on track? On a deeper level, was the notion that specific concepts such as “Pout” — a post route from the outside receiver and an out route from a slot receiver — a smart design?
We began by constructing a dictionary of route concepts. The data we were given only had the individual routes for each receiver, so we had to construct a foundation for then identifying the concepts used on each play. This is where I came in handy, given my penchant for studying playbooks in my spare time. I’m super fun at parties…
With out dictionary in hand, we tested it against the data. As you can see, that netted us around 70% of the plays. I will say the modeling imagery of each concept is pretty cool:
Then, we — the “we” is used rather loosely there — constructed a means of identifying the unknown concepts. Using a Convolution Neural Net (Google it like I did) we were slowly able to train the model to identify the rest of the concepts. As someone who loves “Hoss,” or “hitch-seam,” when the model identified this as Hoss I was almost speechless:

I mean, that is textbook.
So, we had most of the plays now identified due to concept. It was time to have some fun with the data, and to put my preconceived notion of the future of football to the test.
One of first things we did was look at each concept in terms of Expected Points Added. While it might not be a perfect metric, EPA does a good job of illustrating how efficient a given play was for the offense, and variations of EPA or different studies can dive into a defense’s performance, a quarterbacks’ performance, or even how individual players are doing in coverage.
Here are the results:
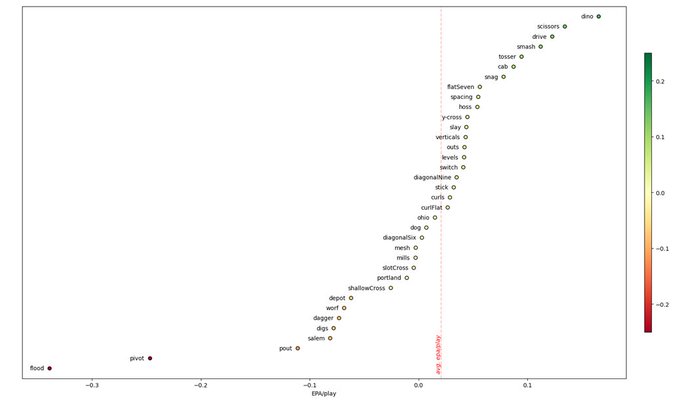
WELP.
Yeah, one of those two dots near the bottom, and the second-worst performing concept, is my beloved Pout.
Now I have a hypothesis on this, and we will return to this concept in a moment, but this was fascinating. Now, there are sample size issues, including the fact that Flood was one of the least-identified concepts in our sample, but this was eye-opening to me.
Another test we performed was to look at each concept in terms of how it fared against MOFC and MOFO coverages. This was something I was deeply interested in. As I have written in the past, one of the first things QBs do when they get to the line of scrimmage is identify the safeties pre-snap. Are they showing one-high safety or two? Then, as the play unfolds, progressions are sometimes read in terms of MOFC versus MOFO.
For example, in college one of my favorite concepts to run was our 585. Comeback — or 5 — routes on the outside, a post route from the tight end or the slot receiver. Against MOFO coverages (Cover 2/4/6) we would read that to the strongside: Looking first at the post to split the safeties, then the comeback route, and finally the checkdown in the flat area. Against MOFC coverages (Cover 1/3), we read that weakside, looking at the X receiver’s comeback first, and then the checkdown to that side of the field.
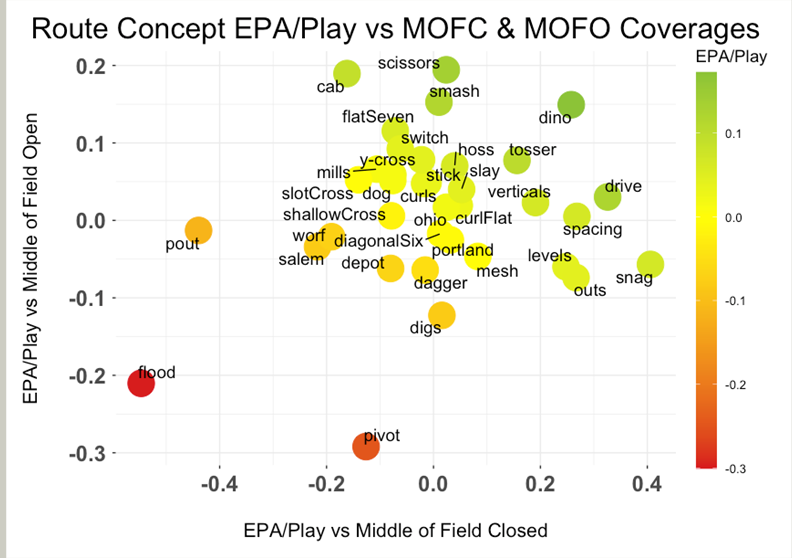
At this point, my beloved Pout is on life support.
Something that also stands otu about this graphic is concepts that perform well against both MOFC looks as well as MOFO looks have an answer for both. Take “Dino,” or double-post. Against say Cover 2 you have the chance to split the safeties with the inside post. Against Quarters you have the chance to hit the outside post against a cornerback playing with outside leverage and expecting inside help, which gets occupied by the inside post. A similar situation plays out on Dino against Cover 3, with the post safety taking the inside post route, and now the cornerback left one-on-one on the outside post.
Another example is “Smash,” which is a concept that looks to high-low the curl/flat defender with a corner route and a route to the flat. Whether MOFO or MOFC there is going to be a curl/flat defender, and the routes are in place to high-low that player and throw off his decision.
We also took the time to look at “Explosiveness” versus “Consistency” regarding the success of route concepts:
This, as Keegan points out, makes sense. Concepts that we found to be explosive tended to be in the downfield passing game, while concepts that were more consistent were concepts you would find in the quick game part of the playbook. Those included “Tosser” (double-slants), “Outs,” and “Stick.” Those route concepts are easier throws to complete and rely on yardage after the catch to become big gains.
We then looked at each offense through this lens:
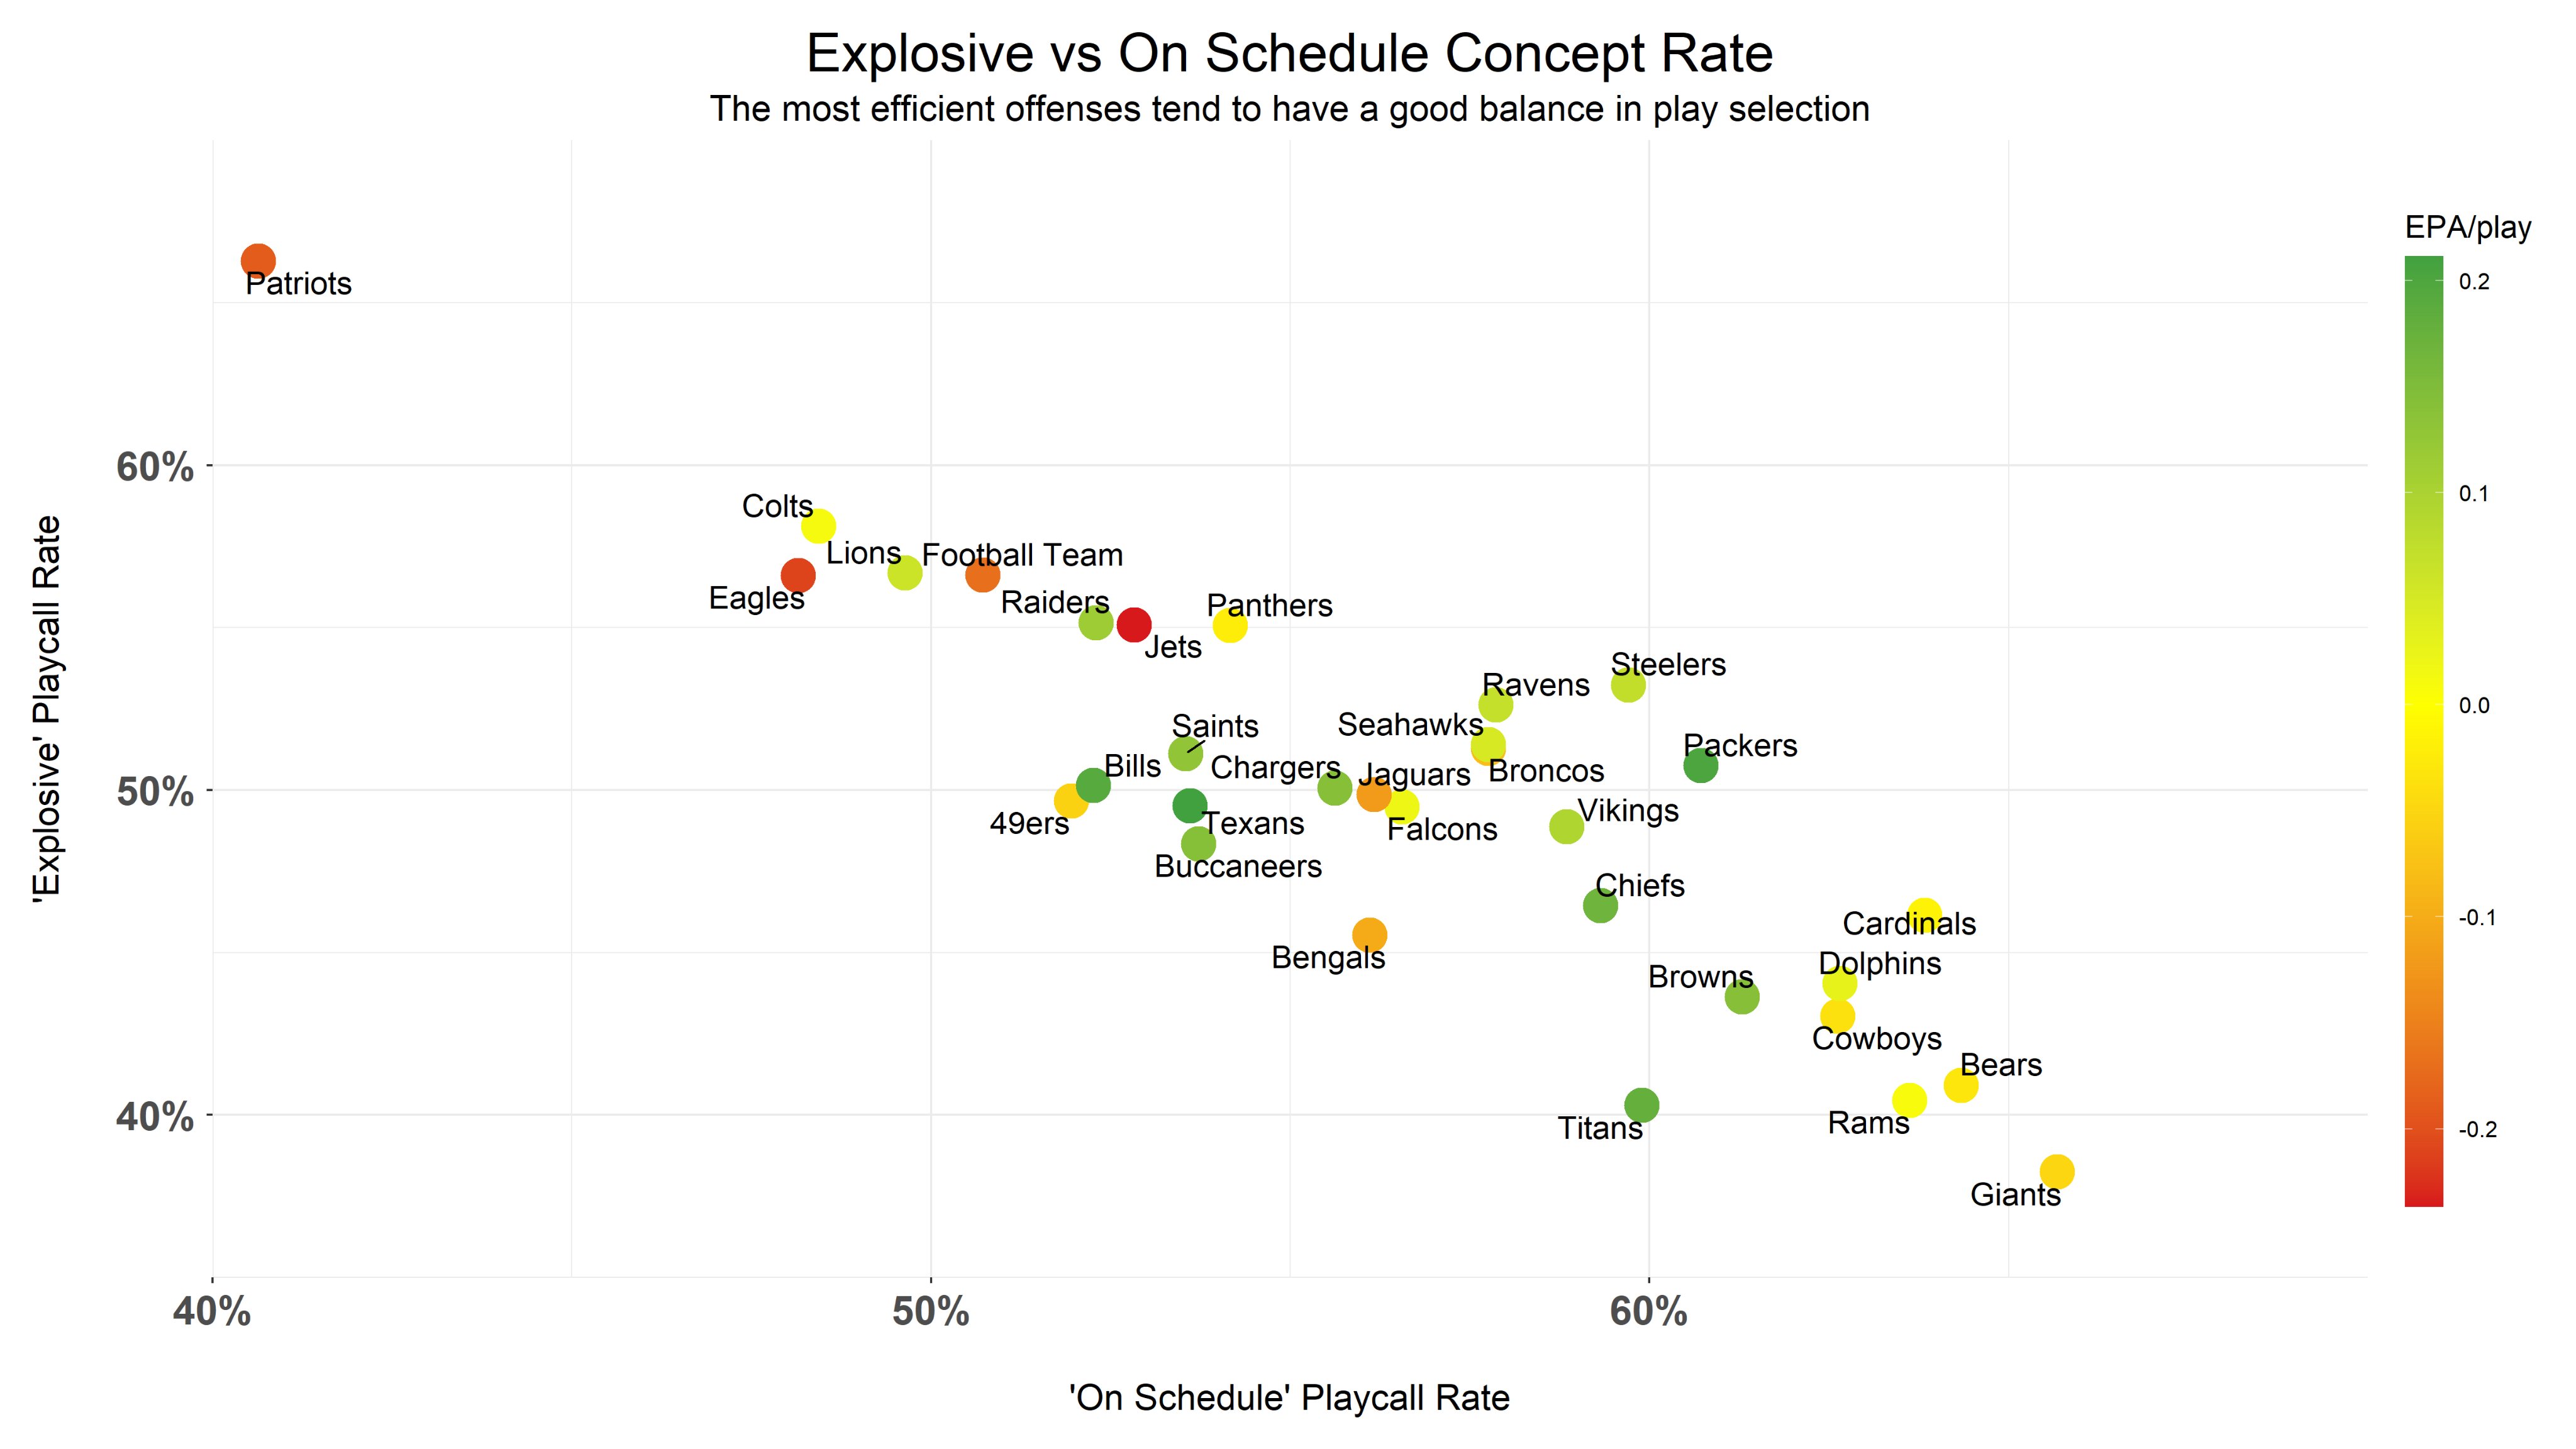
As the findings indicate, the better performing offenses tend to have a good blend of explosive playcalls with on-schedule playcalls. The huge outlier is, as you can see, my beloved New England Patriots. (At this point my ego is just taking body blows). But anyone who watched the Patriots offense last season can understand this result. While in years past the Patriots would rely on the short passing game as an extension of their running game, last year the running game was the focus, and when New England took to the air, they looked to attack downfield.
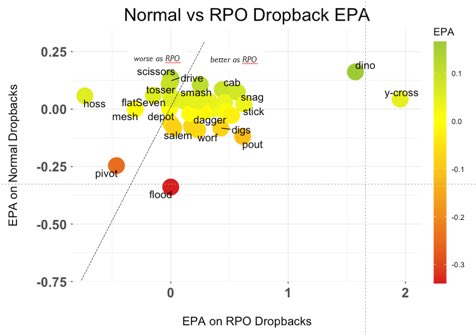
We can close with this. Back this winter when I wrote that “Future of Offensive Football” piece, I viewed things through the prism of the run/pass option play. After all, with defenses wanting to dare teams to run the football, and crafting ways to defend the pass against RPOs by means such as “slinging the fits,” I was extremely curious to see if efficiency on these concepts changed when run as an RPO.
Here are the results, and for those wondering, I made this one!
Ok I still needed some help. Again, monkey banging away at a typewriter here…
Redemption for Pout!?
Now we had a sample size issue here, as many of these concepts were run as an RPO just a handful of times, as my crude attempt at bar graphing illustrates:

So you can see that many of these were indeed run a handful of times. Yet, Pout fared much better as an RPO than a “traditional” dropback.
Now, time for a revised hypothesis about my beloved design.
Pout is perhaps effective as an RPO design because of the conflict placed on the curl/flat defender. Get into the run fit or buzz to the flat to take away that out route? Of course, this gets us into the idea of “slinging the fits” — which I talk about in that earlier article — as well as the debate over whether there are truly “in conflict” defenders. Another idea kicking around in my head is that it might be more effective at the college level, particularly as an RPO, given the different rules on those plays.
Something to test in the fall…
In the end, my biggest takeaway is this: I had a blast. I cannot thank the other three members of the group for letting me be a part, and seriously go follow them. They’re all brilliant.
As for me, I’m now surrounded by books on how to learn both R and Python. I’m excited to put more ideas to the test over the coming weeks and months. That’s the beauty of this analysis: Taking something you see on film and putting it to the test using the data.


