The Vikings have been extremely unlucky

The Minnesota Vikings have been incredibly unlucky so far in 2023

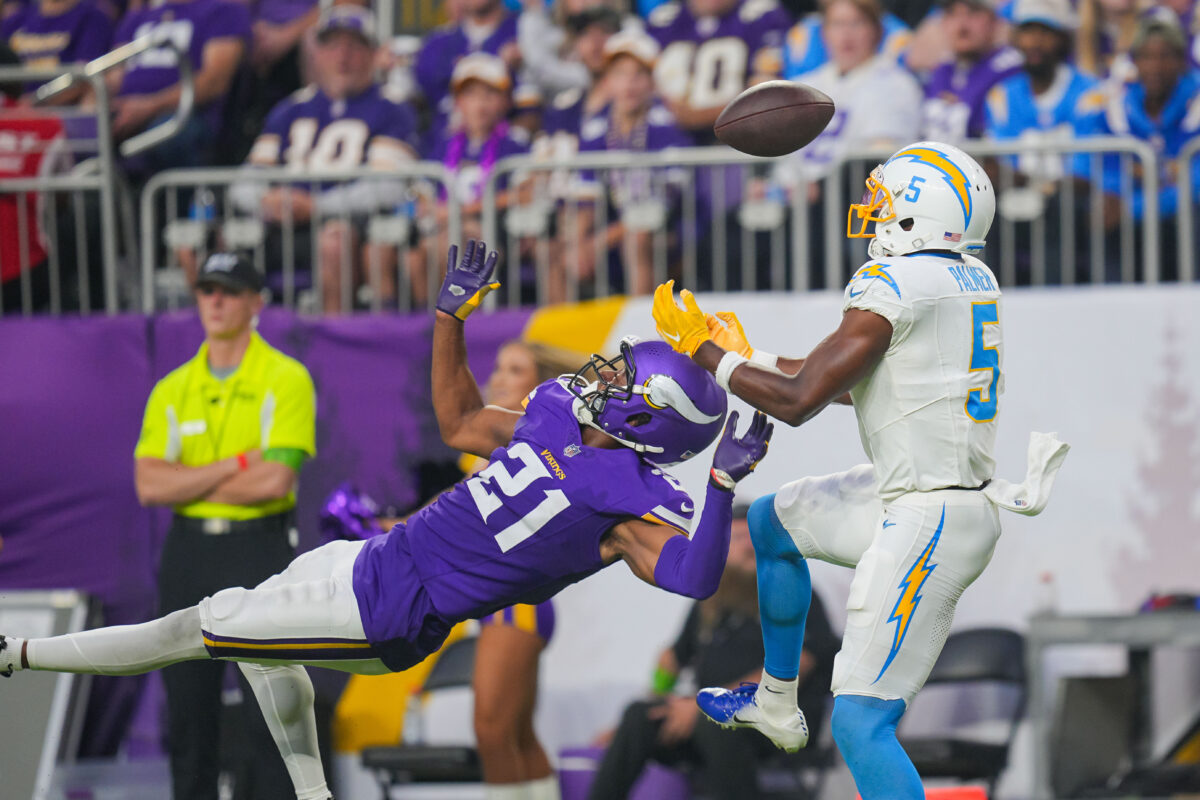
One of the many frustrations with the Minnesota Vikings’ 0-3 start has been the turnovers. Nine of them across three games is brutal for both fans watching the game and also for their record.

When you take a look at win probability added based on certain plays, the Vikings were fifth in the league last year. They were very advantageous in situations last season and went 11-0 in one-score games.

This year? It’s the exact opposite, as they are last in the National Football League.

The plays that are used in this exercise by Tom Bliss are as follows:

  • Dropped interception by the opponent
  • Dropped pass by opponent
  • Field goals and extra points attempted by the opponent
  • Fumble recoveries by either team

With the Vikings, they were negative in all four, but the most egregious was the field goals and extra points. The Vikings are giving up too many chances and their opponents are taking advantage.

Theoretically, the Vikings will regress to the mean and be much better than worst in the National Football League. Things aren’t great right now, but it’s easy to see a better path forward.

[lawrence-related id=83633,83630,83626,83621,83599,83585]

Data suggests Saints were one of NFL’s luckiest teams in 2022

Data claims the Saints were one of the NFL’s luckiest teams in 2022, with opposing receivers dropping more passes than any other squad in the NFL:

Were the New Orleans Saints lucky to finish the year at 7-10? Maybe so. Research from Tom Bliss, the manager of football ops data science for the NFL, found that the Saints benefited from a lot of bounces going their way during the 2022 season. He points to examples of luck like the opposing team dropping would-be interceptions, fumble recoveries, missed kicks and opposing receivers dropping passes. Bliss took each of those stats and tabulated them into wins added per team.

Bizarrely, the Saints ranked high in a lot of those categories. New Orleans led the NFL in opponents’ dropped passes, which added a full +1.15 win to their cumulative total. And they stood out from the pack by a wide margin there, with next-closest being the Jacksonville Jaguars (+0.79). Their final ranking in the “good luck” rankings was seventh-best in the NFL.

However, that freakish performance outweighed the Saints’ more typical performance in other areas. They ranked near or below league average in opposing teams’ dropped interceptions (+0.02), missed kicks (-0.38) and fumble recoveries (-0.18). So if their luck with those dropped passes was closer to normal, the Saints look more like pedestrians than leaders in these good luck rankings.

Here’s the full tabulation from Bliss:

As we can see, the New York Giants were the luckiest team in the NFL last year thanks to good breaks on fumble recoveries and dropped interceptions, while the Buffalo Bills were unluckiest due to so many fumbles getting picked up by the opposing team. Bliss considered fumbles as examples of 50/50 randomness to even the playing field in that category.

Hopefully the Saints can enjoy more good luck next season, but you’d like to think they can figure out enough things within their control to where it doesn’t matter, as was the case for Buffalo, which made it to the second round of the playoffs. New Orleans needs to play better football rather than hope for good fortune in 2023.

[mm-video type=playlist id=01eqbyahgz6p2j3xp7 player_id=01eqbvhghtkmz2182d image=]

[listicle id=121273]

Vikings overcame a massive win probability discrepancy vs. Colts

The Vikings continue to beat the odds

It’s no secret that the Minnesota Vikings had such a small win probability against the Indianapolis Colts at its worst that you couldn’t even give it a full percentage point.

It really shouldn’t be too much of a surprise either, as the Vikings were down 33-0 and were playing atrocious football. The chart itself looked like a plateau and peaked at a whopping 99.6% with 7:36 left in the third quarter.

It goes to show how rare a comeback like this is. Teams that led by 30+ points were 1,548-1 going into week 15 and the Vikings bucked the trend once again.

The Saints’ disastrous win probability chart needs to be seen to be believed

The Saints’ disastrous win probability chart needs to be seen to be believed. They had this in the bag, until they literally gave it away:

This really tells the whole story, doesn’t it? Depending on which sources you went with, the New Orleans Saints had a win probability of something between 97% and 98% late in Monday night’s game with the Tampa Bay Buccaneers. They were leading by double digits and dropped a punt at the Tampa Bay 9-yard line with just over 3 minutes left in regulation.

Then Tom Brady got busy, with some help from Paulson Adebo on an unnecessary penalty for defensive pass interference that moved the Buccaneers offense 44 yards upfield, all the way up to the New Orleans goal line. And the Saints had no response.

Look at their final possession. Alvin Kamara runs for 3 yards. Facing 2nd-and-7 from his own 28-yard line, Pete Carmichael Jr. took Chris Olave and Rashid Shaheed off the field and subbed in practice squad wideout Kirk Merritt. With no quick options to throw to, Andy Dalton was sacked at the 18-yard line. On third down with the game — and the season — on the line, Carmichael dialed up a pass to Taysom Hill down the season in-between three Buccaneers defenders.

To their credit, Dalton placed the ball perfectly. And at first, Hill held onto it. But the collision jarred the ball loose and the Saints had to punt with 2:39 left in regulation. That was all too easy for Tampa Bay.

All these details and more are illustrated on the interactive win probability chart from NumberFire, which you can find here. It shows how the Saints gave it up in this game, where they went wrong, and which plays had the greatest impact on their loss. It’s altogether a heavy indictment of Dennis Allen and Carmichael’s poor situational decision-making. How much longer can this be allowed to continue? What more do Mickey Loomis and Gayle Benson need to see before demanding accountability?

[mm-video type=playlist id=01eqbyahgz6p2j3xp7 player_id=none image=https://saintswire.usatoday.com/wp-content/plugins/mm-video/images/playlist-icon.png]

[listicle id=119233]

LOOK: Falcons’ win probability chart vs. Saints has to be seen to believed

LOOK: Falcons’ win probability chart from their fourth-quarter collapse vs. Saints has to be seen to believed

Whew. Let’s all take a deep breath. Sunday’s season opener between the New Orleans Saints and Atlanta Falcons was a roller coaster ride from start to finish, peaking in the fourth quarter with a 16-point New Orleans rally for the huge road win.

And you can see this roller coaster laid out in a helpful graphic with this week’s win probability chart. Initially shared by the Athletic’s Nate Tice, you can explore the chart in greater detailing at NumberFire. It factors in all plays — scores, big gains, negative yardage, critical down results, all of them — to estimate win probability on a per-snap basis and fully illustrate the game.

Everything is there: Younghoe Koo’s early-game field goal that gave Atlanta the lead, and a couple of big plays from Taysom Hill that swung it the other way, with the odds climbing in New Orleans’ favor. But then things took a turn, and a sharp dip to almost guarantee the win for Atlanta. At its lowest point, the game had a 95.52% chance of going the other way.

Then the Saints offense shook off the rust, Michael Thomas bullied top Falcons corner A.J. Terrell for a couple of touchdown catches, and the black and gold came out on top. It was quite a ride, and seeing it laid out like this is fascinating. It’s a unique postmortem on yet another Falcons second-half collapse.

You can change the coach, and the quarterback, but the Falcons are still the Falcons. They’ll keep losing games like this in a bleak echo of their Super Bowl LI defeat until the end of time. This is who they, are this is what they do. And the Saints will be there to benefit from it.

[listicle id=115569]

LSU’s NCAA Tournament win probability is surprisingly high, per Basketball Power Index

The Tigers have a better chance at a deep run than most No. 6 seeds.

The Tigers head to Milwaukee this weekend for the first leg of what will hopefully be a three-week journey in March Madness.

As the No. 6-seed in the Midwest Region, LSU draws a matchup with No. 11-seeded Iowa State out of the Big 12 in the first round. However, this is not a team playing its best basketball right now.

It went 3-4 in its final seven games of the season and was bounced in the quarterfinals at the SEC Tournament by Arkansas last week. To make matters worse, the Tigers are being led into March by an interim coach in Kevin Nickelberry, who took over on Saturday after the program fired coach Will Wade.

In spite of all of that, LSU odds of advancing deep in the tournament are actually fairly solid, according to the latest probabilities from ESPN’s Basketball Power Index. Here’s how it breaks down.

Basketball Power Index Probability

Round 2nd Round Sweet 16 Elite Eight Final Four Champ Game Champs
Probability 71.8% 49.3% 24.2% 10.5% 3.8% 1.3%
Ranking No. 19 No. 16 No. 15 No. 15 No. 15 No. 15

As you can see, LSU’s worst relative odds are actually in Round 1 against the Cyclones. It’s a tough opening draw, certainly more difficult than that of many other top seeds.

If the Tigers can get past that one, though, the relative odds get significantly better, with the team ranking among the 15 programs most likely to advance to the second weekend and beyond.

The likely path for LSU if things played out in a chalky manner would feature matchup against No. 3-seeded Wisconsin in the second round, No. 2-seeded Auburn in the Sweet 16 and No. 1-seeded Kansas in the Elite Eight.

Per these odds, the Tigers are a fairly heavy favorite in the opener and are given about a coin-flip to beat the Badgers and advance to the second weekend for the second time in the last three tournaments. 2019’s Sweet 16 run was the first time the team had made it out of the first weekend since a Final Four run in 2006.

The Tigers will look to get past a scrappy Iowa State team on Friday and make a run.

[mm-video type=video id=01fy814q0z2gt0ndr19g playlist_id=01eqbz5s7cf4w69e0n player_id=01eqbvp13nn1gy6hd4 image=https://images2.minutemediacdn.com/image/upload/video/thumbnail/mmplus/01fy814q0z2gt0ndr19g/01fy814q0z2gt0ndr19g-58e2d83ba1f721a926bc51a12aca2992.jpg]

[listicle id=49207]

Contact/Follow us @LSUTigersWire on Twitter, and like our page on Facebook to follow ongoing coverage of Louisiana State news, notes, and opinions.

Follow Tyler to continue the conversation on Twitter: @TylerNettuno

Updated look at Auburn’s win probability over the final four games

Breaking down win probability over the final four games.

Yes, the loss against the Florida Gators hurt but given that it was their third loss of the season, it isn’t all doom and gloom for Auburn men’s basketball. Head coach Bruce Pearl understands that there is ample work still to be done before the NCAA Tournament arrives.

Florida played well, Pearl said. “Especially in the second half, so give Florida all the credit for us not playing well.”

The team committed 17 turnovers that led to nine points for the Gators. In a one-point loss, that means everything. In their two losses over the last four games, the sloppy play has led to losses by a combined five points. The biggest question mark was the final play that was drawn up by Pearl.

“I probably should’ve called timeout once I saw Florida back off,” Pearl said “They kept everything in front.”

It was a teaching moment for the team and a moment of reflection for the head coach. However, the team must shift focus to the final four games instead of dwelling on the loss.

With just four games remaining, two at Auburn Arena, we have the updated win probability per the Basketball Power Index.

Win Probability Breakdown

Matt Pendleton-USA TODAY Sports
  • Feb. 23 vs Ole Miss Rebels: 93.8%
  • Feb. 25 at Tennessee Vols: 29.5%
  • Mar. 2 at Mississippi State Bulldogs: 57.7%
  • Mar. 5 vs South Carolina Gamecocks: 92.7%

Based on the win probabilities Auburn would finish with a record of 26-4 in the regular season ahead of the SEC tournament. They currently hold a one-game lead over Kentucky but due to head-to-head, it is actually a two-game lead.

If the season ended today, Auburn would play the winner of Mississippi State and South Carolina on Mar. 10 in the SEC tournament.

[vertical-gallery id=42244]

5 biggest EPA, WPA plays of Cowboys Week 8 win required skill, perserverance, luck

The Cowboys won nail-biter against the Vikings in a game that defied the odds as they picked up victory No. 6. A look at the EPA gains and WPA shifts of the biggest plays in the comeback. | From @ProfessorO_NFL

The Dallas Cowboys travelled to the land of 10,000 lakes to face the Minnesota Vikings on Halloween.  With the contest competing head to head with Game 5 of the World Series, the NFL matchup drew a larger audience with 12.82 million viewers.  Prior to the start of the game, the then 5-1 Cowboys reported quarterback Dak Prescott would be inactive leading the way for backup QB Cooper Rush to get his first NFL start.

Rush was ready for his big moment and overcame an up and down first half to throw for over 300 yards and lead a scoring drive with less than a minute left in the game to hand the then 3-3 Vikings their fourth loss of the season.

In a game with a backup quarterback making his first NFL start, the Cowboys lost the turnover battle for the first time this season, were called for over 10 penalties and trailed the majority of the game. As the saying goes, “good football teams find ways to win” and the Cowboys did just that.

Here are the five biggest plays of the game using Expected Points Added (EPA) and Win Probability models from rbsdm.com. EPA is a formula that takes historical data and applies it to every play to determine if it increases or decreases a team’s expected points given the outcome of that play.  Every down and distance has a level of expected points; the likelihood a team will score on that particular drive based on that situation. Therefore EPA measures the shift in expected points as a result of a specific play.


ESPN’s updated FPI rankings after Week 5: How do the Big 12 teams stack up?

After the first full slate of conference games in week 5, how does the Big 12 stack up in ESPN’s Football Power Index rankings?

In their win against the Kansas State Wildcats, the Oklahoma Sooners provided answers to a few of the questions that had plagued this team in recent weeks. Namely, the offensive efficiency that led to 37 points was a welcomed surprise. The Sooners methodically drove down the field for four touchdowns and three field goals, scoring on seven of their eight drives during the game.

As a result of the win, ESPN’s Football Power Index (FPI)  has the Oklahoma Sooners as the number four team in the nation. The FPI runs 20,000 simulations to come up with their projections taking into account what they’ve done and what they will do.

If you’re interested in learning more about ESPN FPI, they broke it all down for you. Here’s a brief snippet.

FPI is a predictive rating system designed to measure team strength and project performance going forward. The ultimate goal of FPI is not to rank teams 1 through (130); rather, it is to correctly predict games and season outcomes. If Vegas ever published the power rankings it uses to set its lines, they would likely look quite a lot like FPI. – ESPN Sports Analytics

We use ESPN’s FPI to take look at the Sooners game-by-game win probabilities after each week’s contest to see how the view of the Sooners has changed. In recent weeks, the computer’s confidence in the Sooners has diminished slightly, though they’re still the favorites to win each game on the remainder of the schedule.

In their projections, the Sooners have a 49.7% chance of winning the Big 12 conference and currently a 48.2% chance of making the College Football Playoff.

The benefit of looking at the Sooners’ current projections and where the rest of the Big 12 stacks up, is that it gives a bit of an indication as to how the conference is viewed nationally. When it comes to the College Football Playoff committee attempting to rank teams to contend in the four-team playoff, much of how a team’s opponents are viewed can weigh heavily on the committee’s decision to invite one team over another.

If there are more than four obvious teams in the discussion for a seat at the postseason table, then FPI of the Oklahoma Sooners’ opponents could come into account.

This week, the Sooners face the No. 8 team in the country according to ESPN’s FPI. Other than Kansas, no Big 12 team ranks outside of the top 55. The higher those teams climb, the better for the Sooners.

Let’s take a look at where the Big 12 stands after week five.

ESPN’s FPI predicts the rest of LSU’s season

LSU’s season is on the ropes after losing to Auburn.

[mm-video type=playlist id=01eqbz5s7cf4w69e0n player_id=none image=https://lsutigerswire.usatoday.com/wp-content/plugins/mm-video/images/playlist-icon.png]

LSU’s season took a turn for the worse after losing to Auburn.

The Tigers desperately needed that home win to not only stay alive in the SEC West race, but to get to bowl eligibility at the end of the season. Now, with a daunting stretch of five consecutive ranked teams ahead, LSU is going to need to be even more desperate in their 50/50 matchups.

Here is what ESPN’s FPI says about the rest of LSU’s season after a heartbreaking loss to Auburn on Saturday.

  • Oct. 9 at Kentucky (48.2% chance to win)
  • Oct. 16 vs Florida (32.2% chance to win)
  • Oct. 23 vs Ole Miss (25.6% chance to win)
  • Nov. 6 at Alabama (6.5% chance to win)
  • Nov. 13 vs Arkansas (49.6% chance to win)
  • Nov. 20 vs ULM (98.1% chance to win)
  • Nov. 27 vs Texas A&M (54.5% chance to win)

FINAL 2021 RECORD: 5-7, 2-6 SEC

[lawrence-related id=26598]

If LSU doesn’t make a bowl after having so many returning starters, there will be some issues to address at the top.

[listicle id=26595]